Track Real-Time Liquidation Data
See where traders get liquidated across 5 major exchanges. Analyze positions at risk, identify liquidation zones, and understand market structure with AI-powered signals.
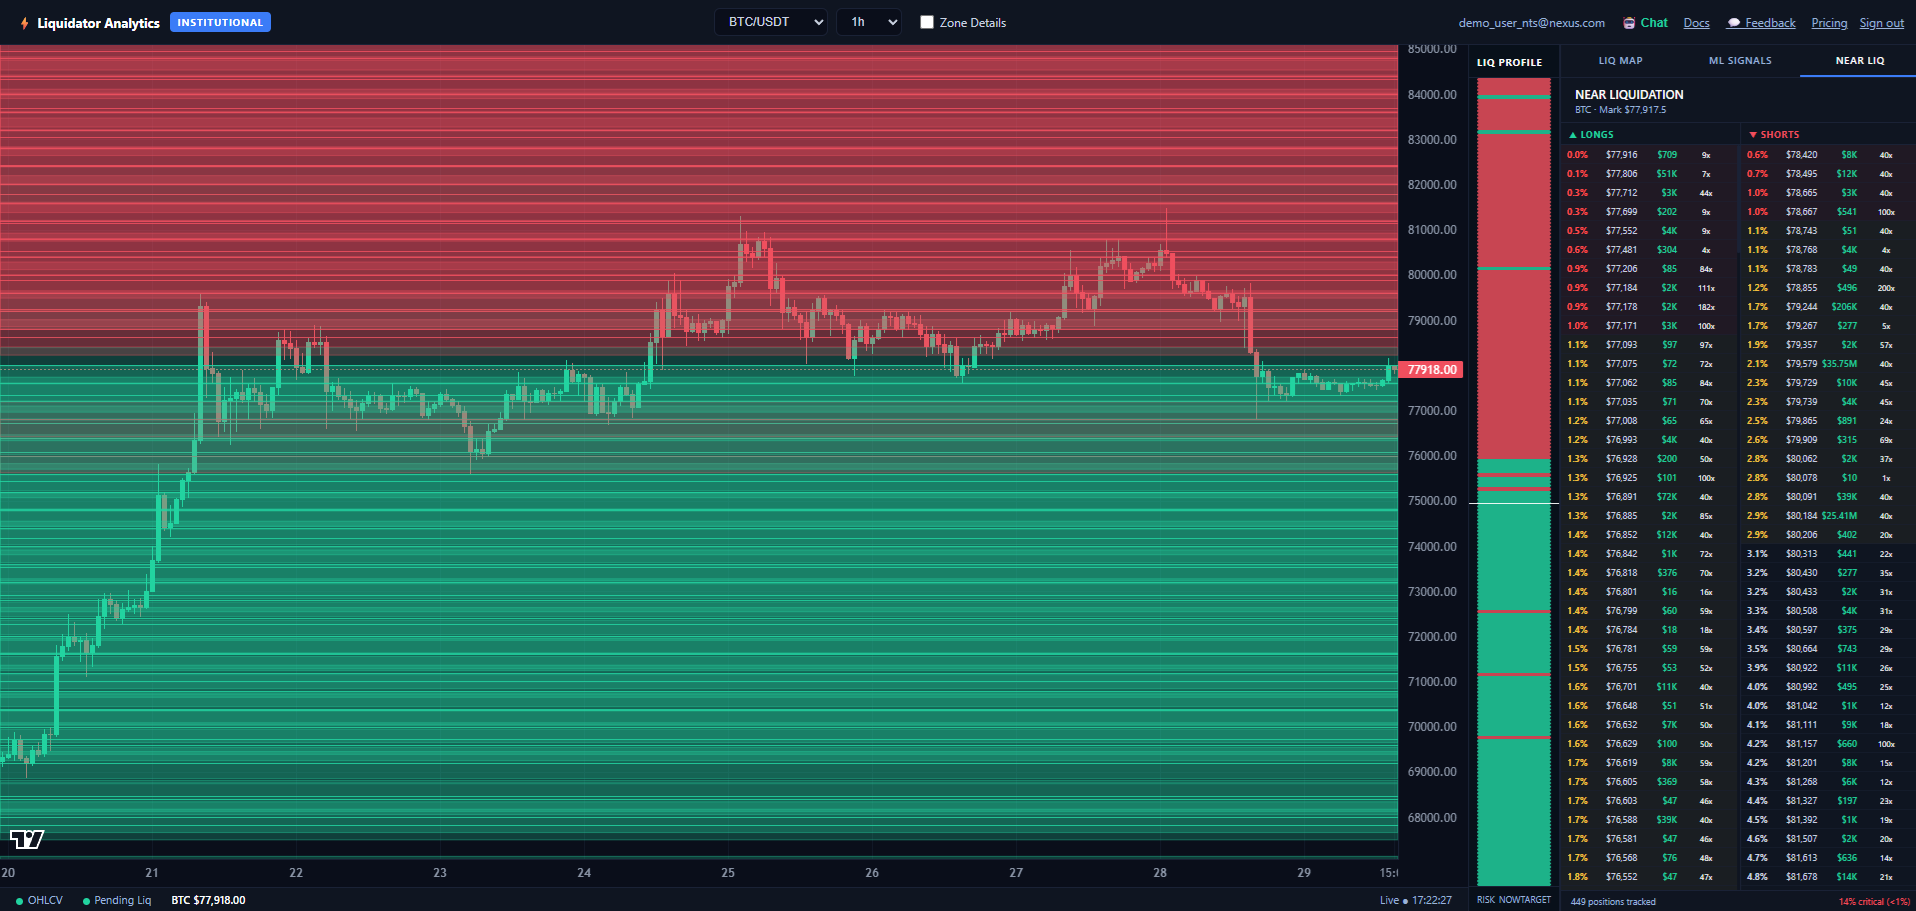
See where traders get liquidated across 5 major exchanges. Analyze positions at risk, identify liquidation zones, and understand market structure with AI-powered signals.
Liquidation data updates instantly as trades happen. See live positions, liquidation zones, and market activity.
Hyperliquid, GMX, Gains, Injective, and Drift Protocol. Coverage across all major perpetual platforms.
See visual clusters of liquidations. Red zones (shorts) and green zones (longs) show where volume accumulates.
Pro+ tiers show real trader positions, leverage, collateral, and distance to liquidation.
Elite+ tiers include AI-powered predictions on whether liquidation zones will HOLD or BREAK.
Ask the chatbot anything about the platform. Semantic matching finds answers from our FAQ instantly.
Liquidation data shows when traders' leveraged positions get force-closed by exchanges when collateral falls below minimum requirements. Our platform visualizes this data in real time.
No. Liquidator Analytics is a data platform only. We provide liquidation information, position tracking, and AI predictions. We do not offer trading advice, strategies, or recommendations.
Crypto traders, quantitative analysts, market researchers, and anyone interested in understanding liquidation dynamics. Useful for spot traders, margin traders, and algorithm developers.
Most exchanges update every 1-5 seconds. All data is real-time or near-real-time based on exchange API capabilities.
No. Liquidator Analytics shows only public liquidation data and anonymized trader positions from blockchain/exchange APIs. Personal account data is never visible on the platform.
Yes, Institutional tier ($349/month) includes full REST API access. Lower tiers do not include API access.